Days |
Hours |
Minutes |
Seconds |
||
1.4°C
Best Linear Fit (1970-2018) (0.17°C/decade) based on GISTEMP data
January, 2020
| Carbon Dioxide avg ppm |
At Today's Rate, 450 ppm will be reached by 2031
Sources: NOAA - Based on Annual Mean Data & Annual Mean Growth Rates at the Mauna Loa Observatory
Last Updated: July, 2020
----------------------
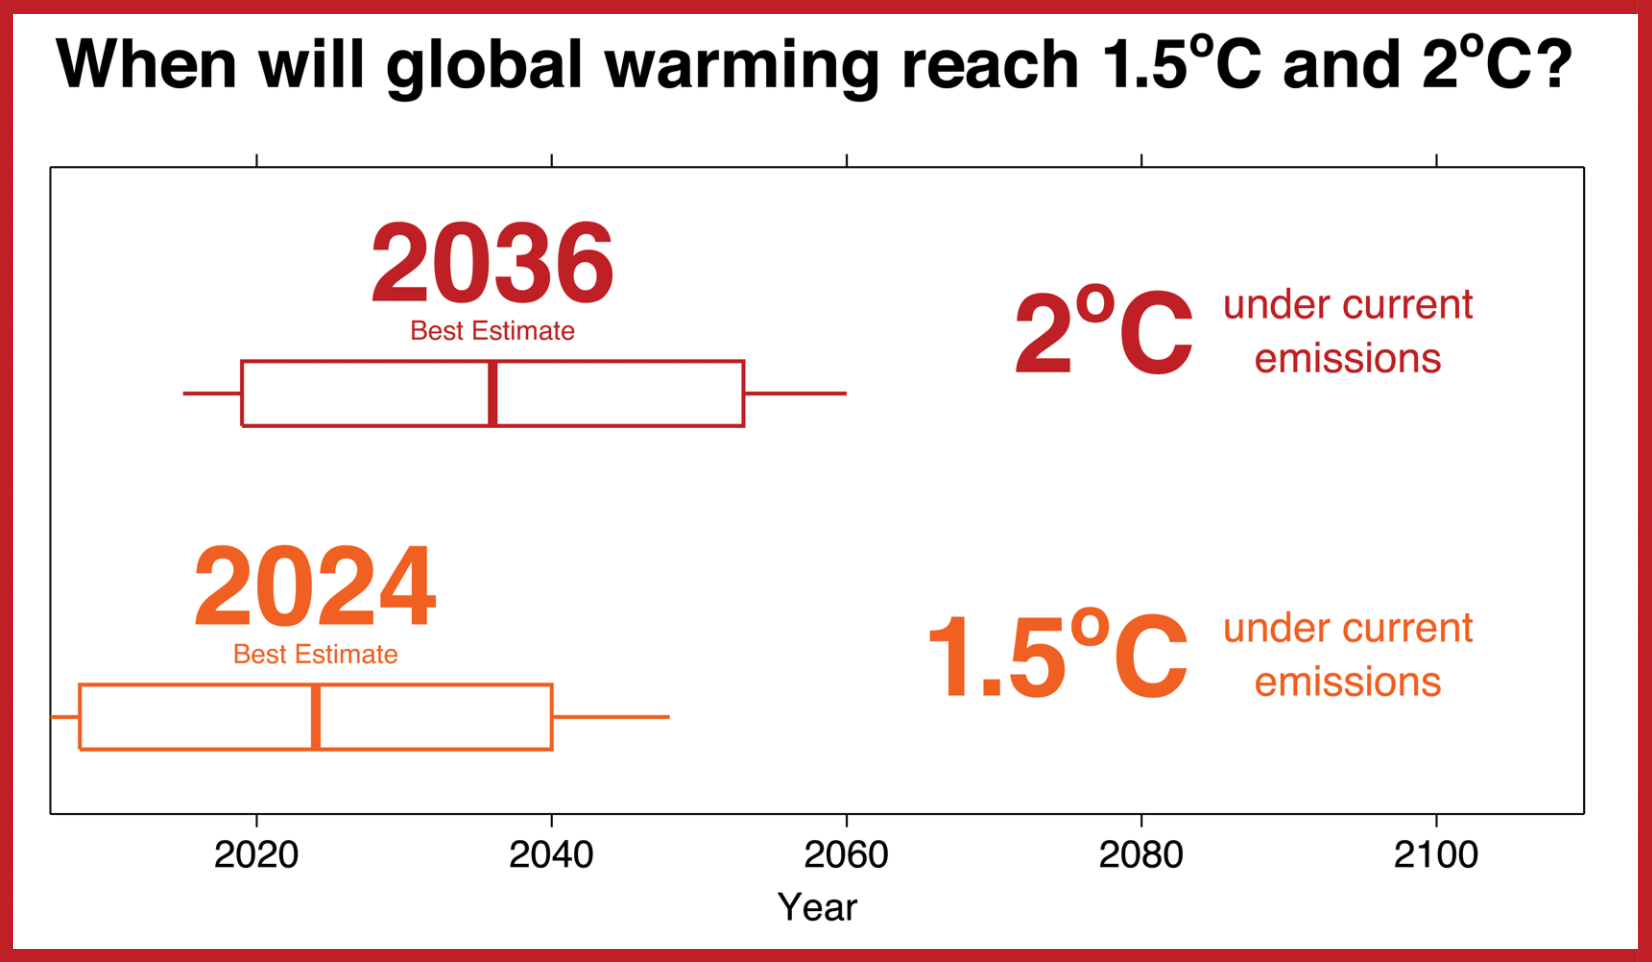
2°C is
A Goal Set in the 2015 UN Paris Climate Agreement,
To Keep the Increase in Global Average Surface Temperature Well Below 2 °C above pre-industrial levels
----------------------
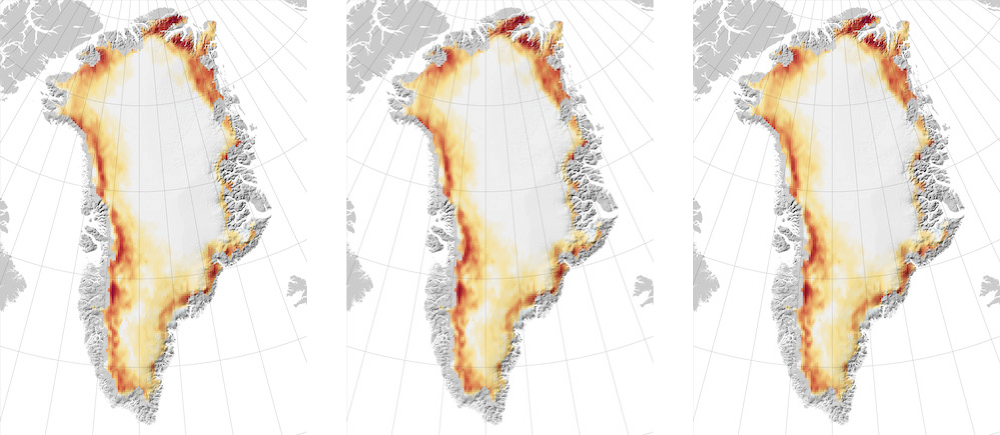
Greenland Reaches Tipping Point, Study Shows
Read the whole thing HERE!
----------------------
----------------------------------------------------------
NASA Surface Temperature Analysis
----------------------------------------------------------
The Cause
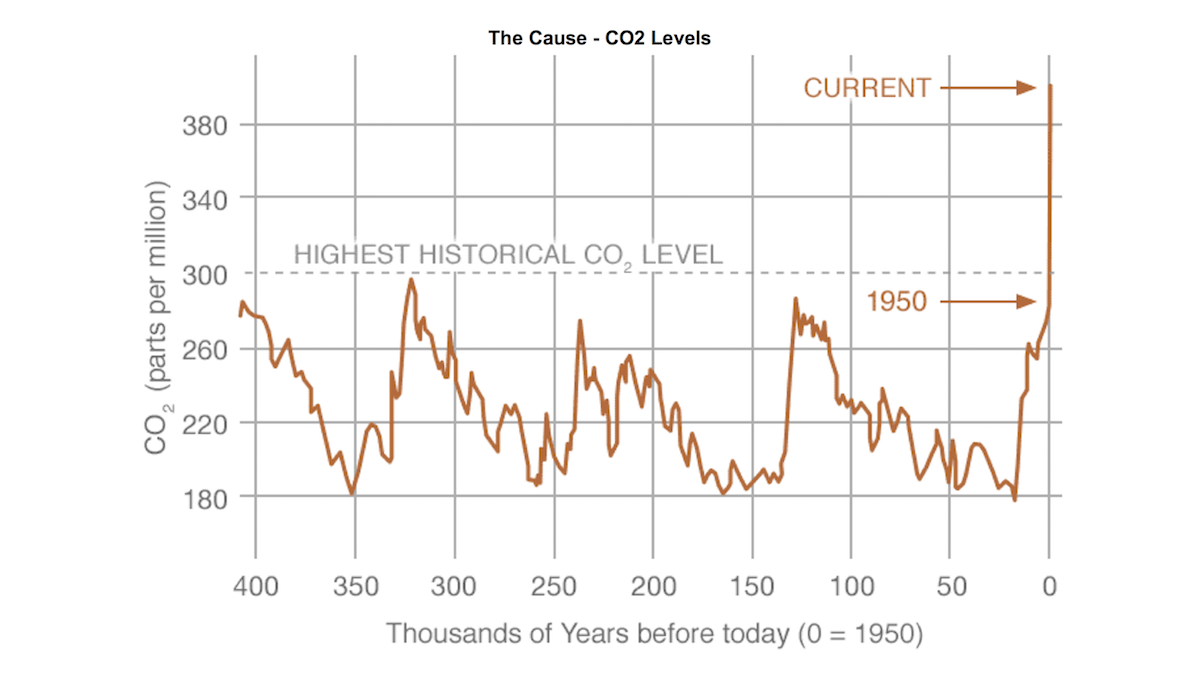
NASA: Climate.nasa.gov/vital-signs/carbon-dioxide/
Data source: Reconstruction from ice cores.
Credit: NOAA
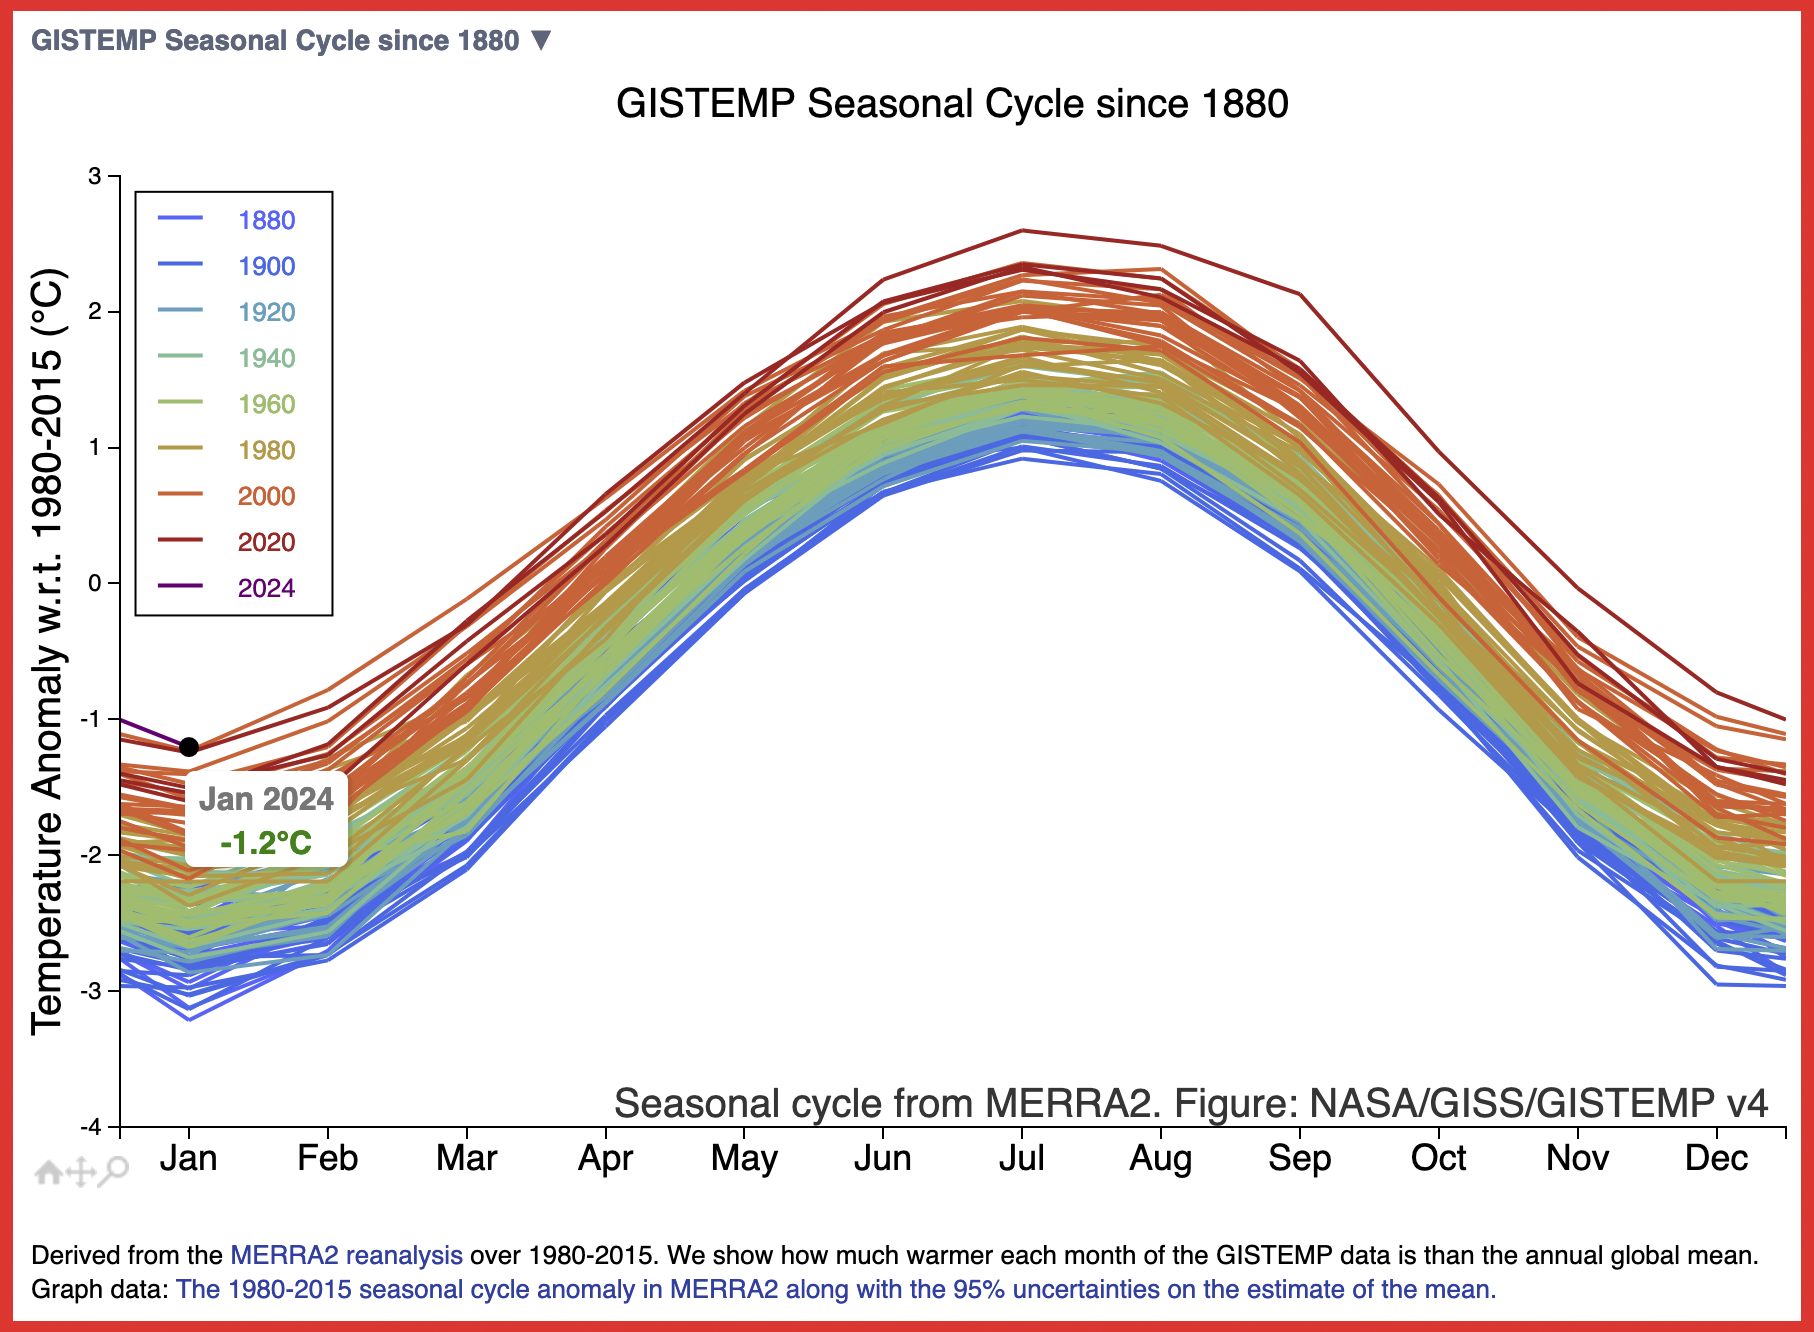
The Effect
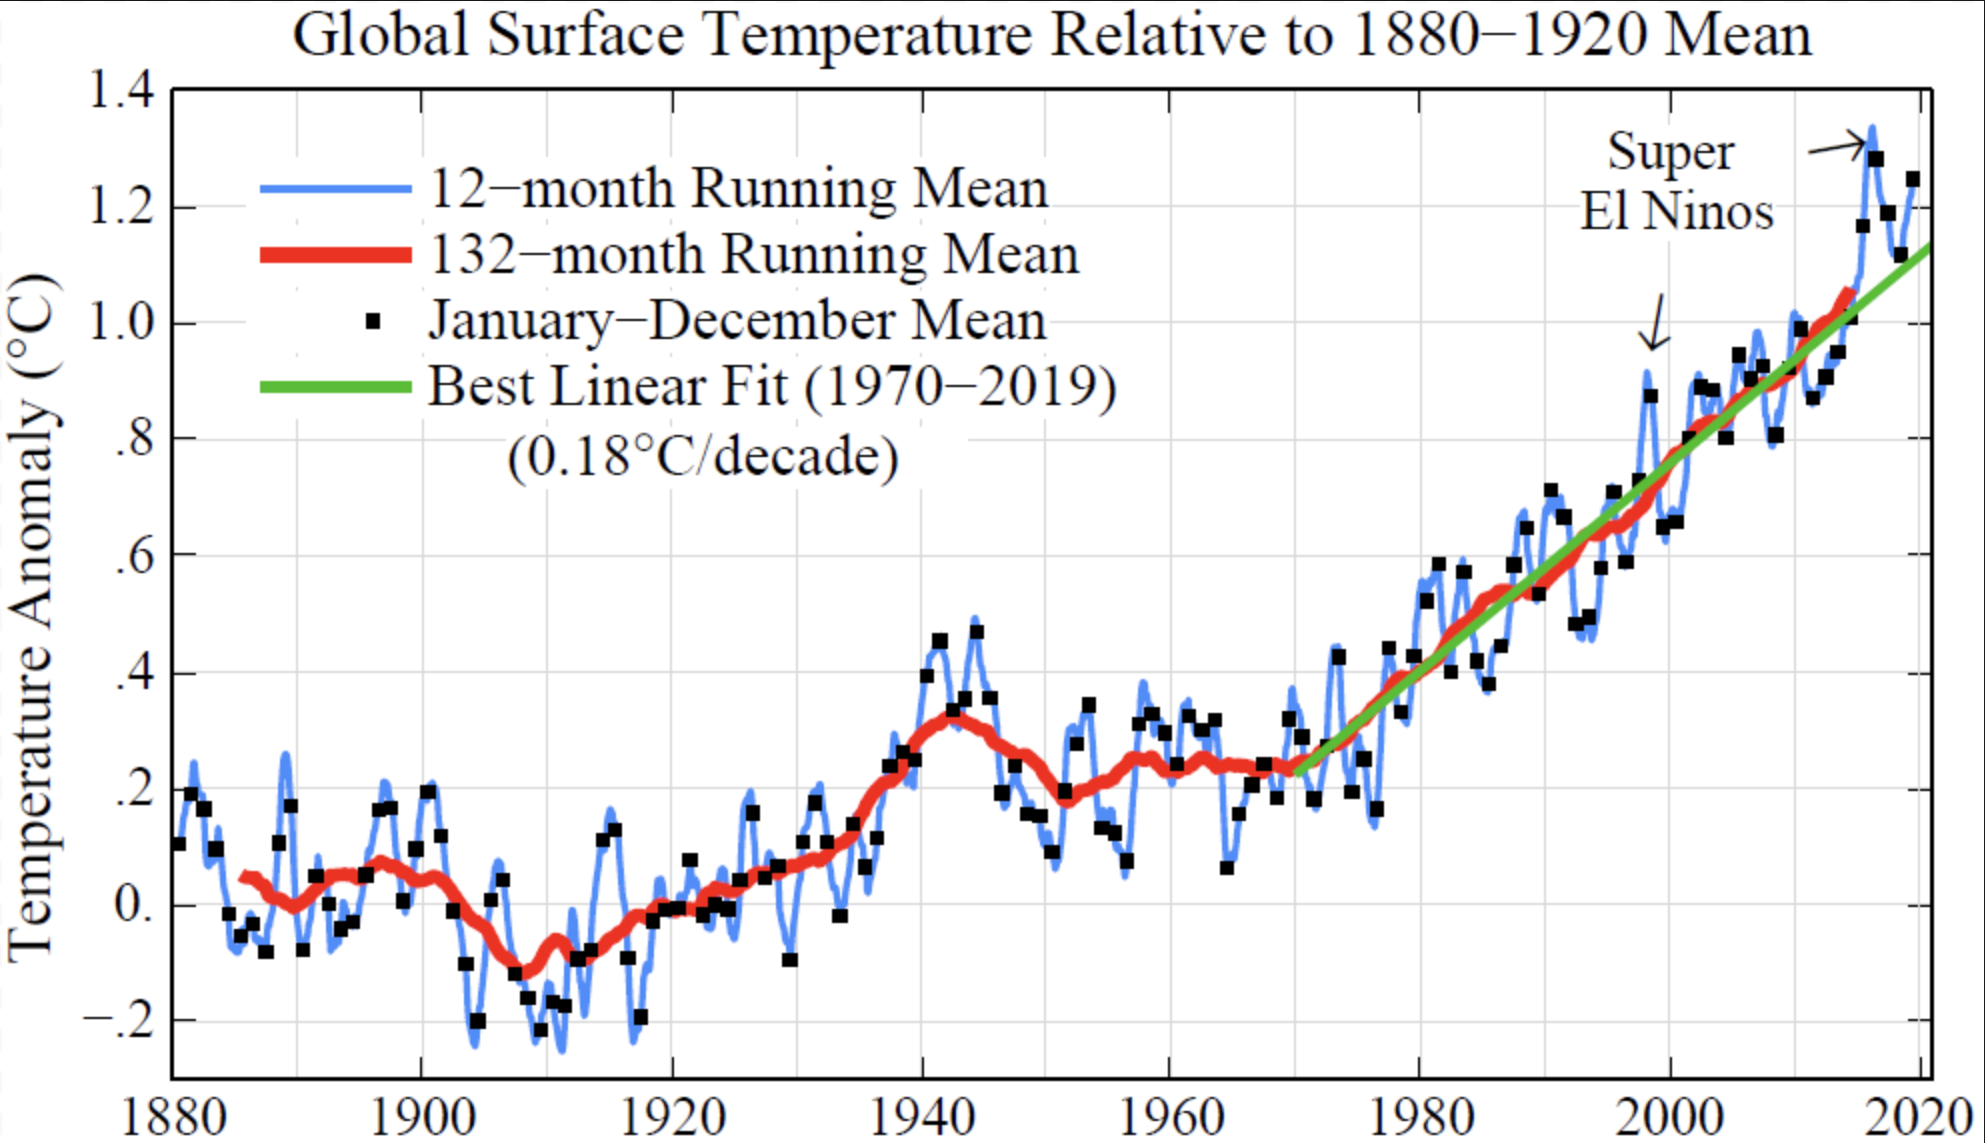
Last Update: Jan 15, 2020, Now with GHCN Version 3.3.0 and ERSST v4.
Temperature Relative to 1880-1920 based on GISTEMP Analysis
(mostly NOAA Data Sources, as described by Hansen, J., R. Ruedy, M. Sato, and K. Lo, 2010)
----------------------------------------------------------
NASA: Climate.nasa.gov
Carbon dioxide levels in the air are at their highest in 650,000 years
-----------------------------
Visualization by Ben Gregory
-----------------------------
-----------------------------
Red Swirls of CO2 - most of which is emitted in the Northern Hemisphere
Source: NASA
------------------------------------------------------------
Sources: (CMIP5; Taylor et al. 2012) RCP8.5
------------------------------------------------------------
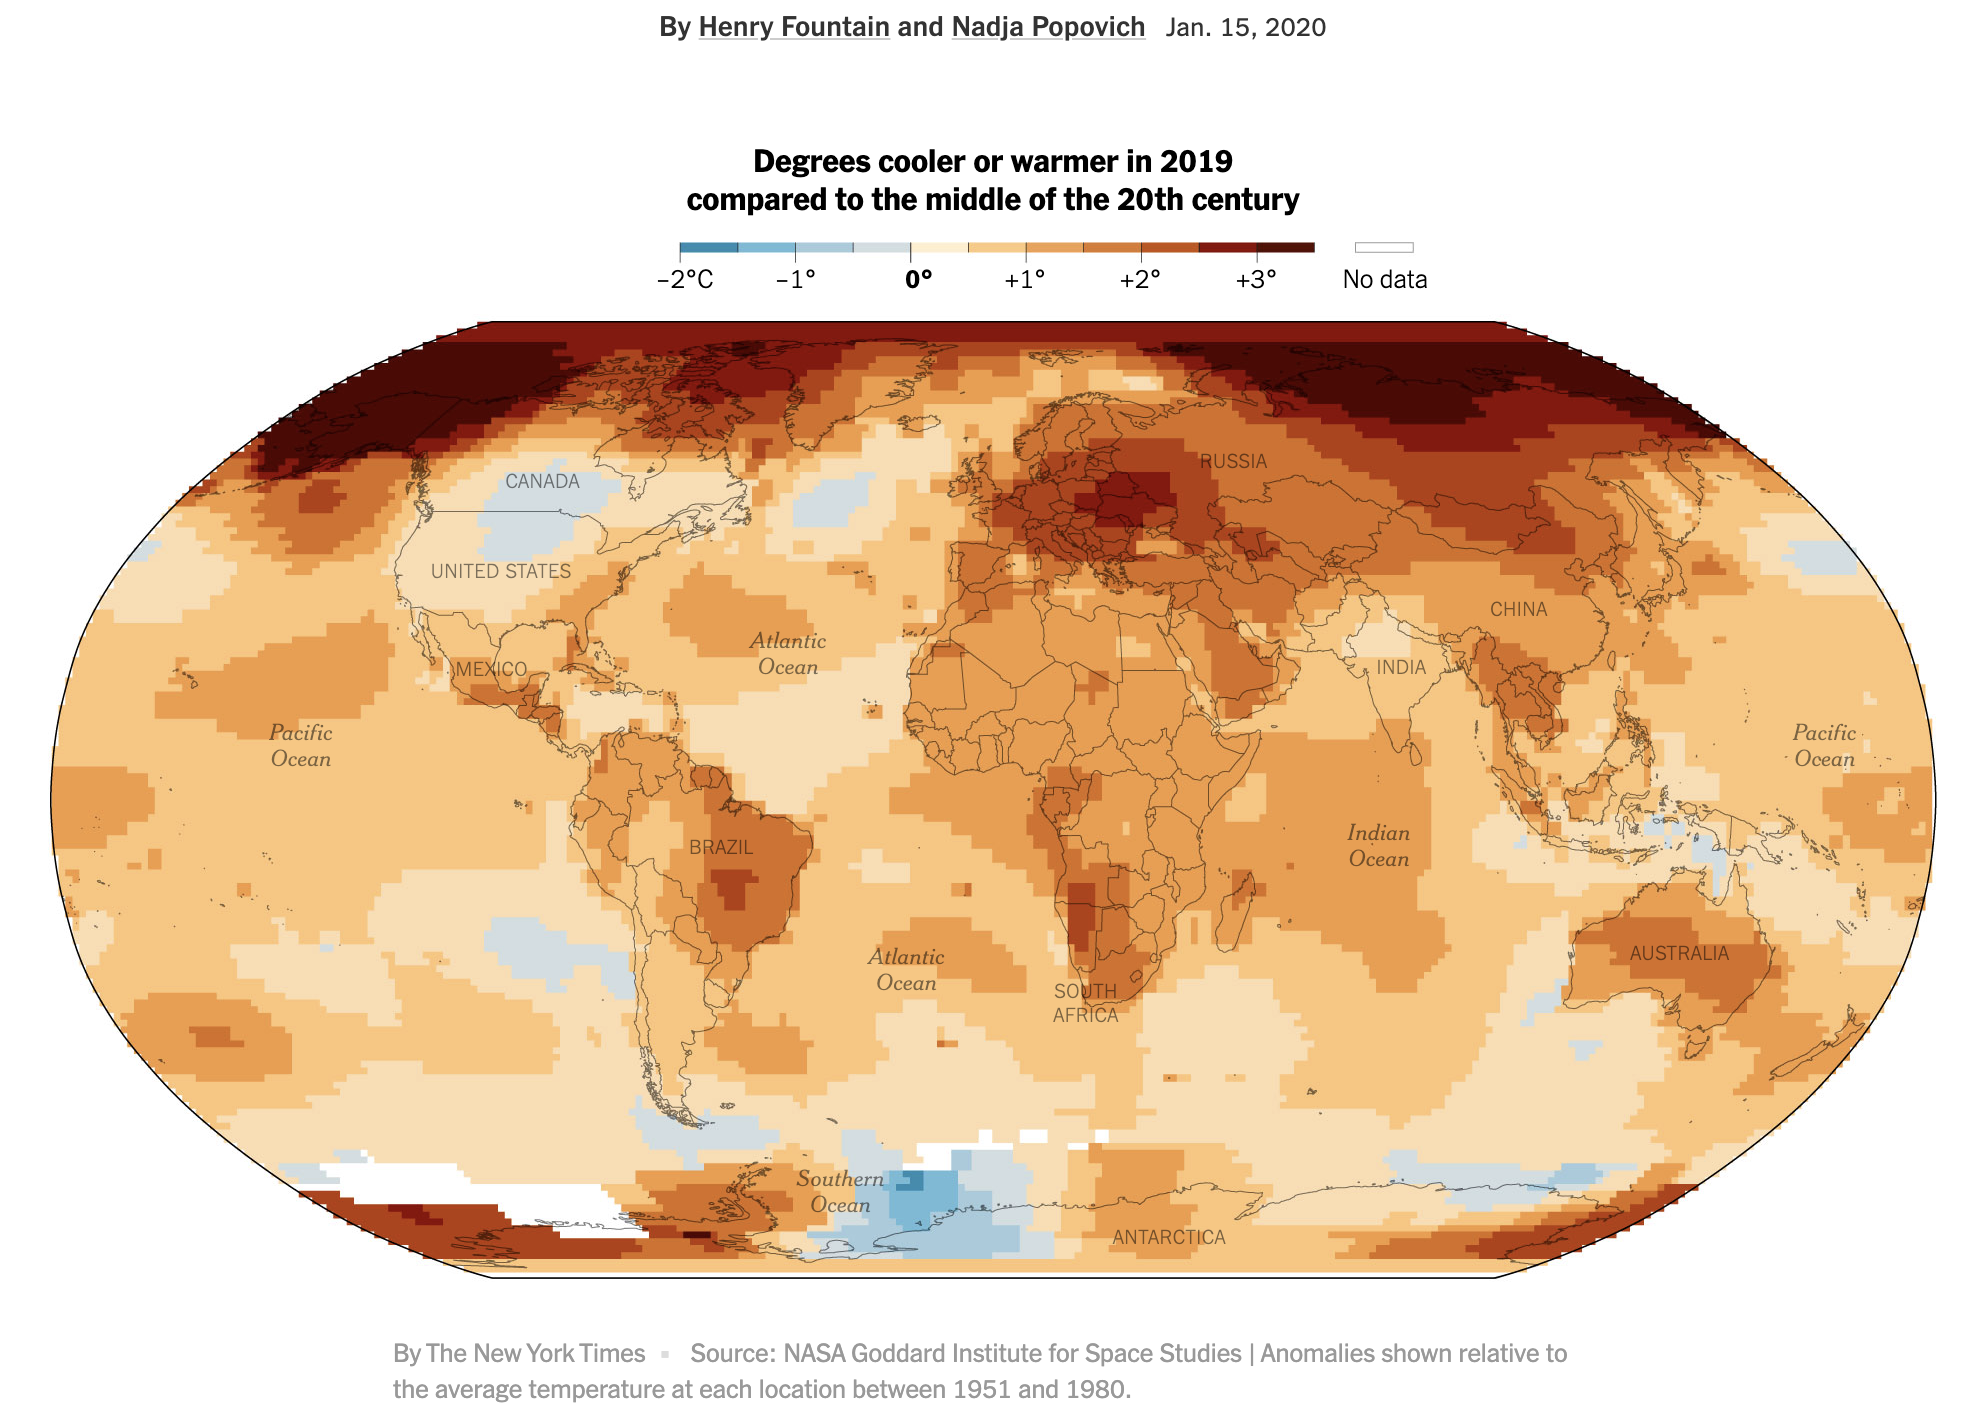
2019
Credit: New York Times
------------------------------------------------------------
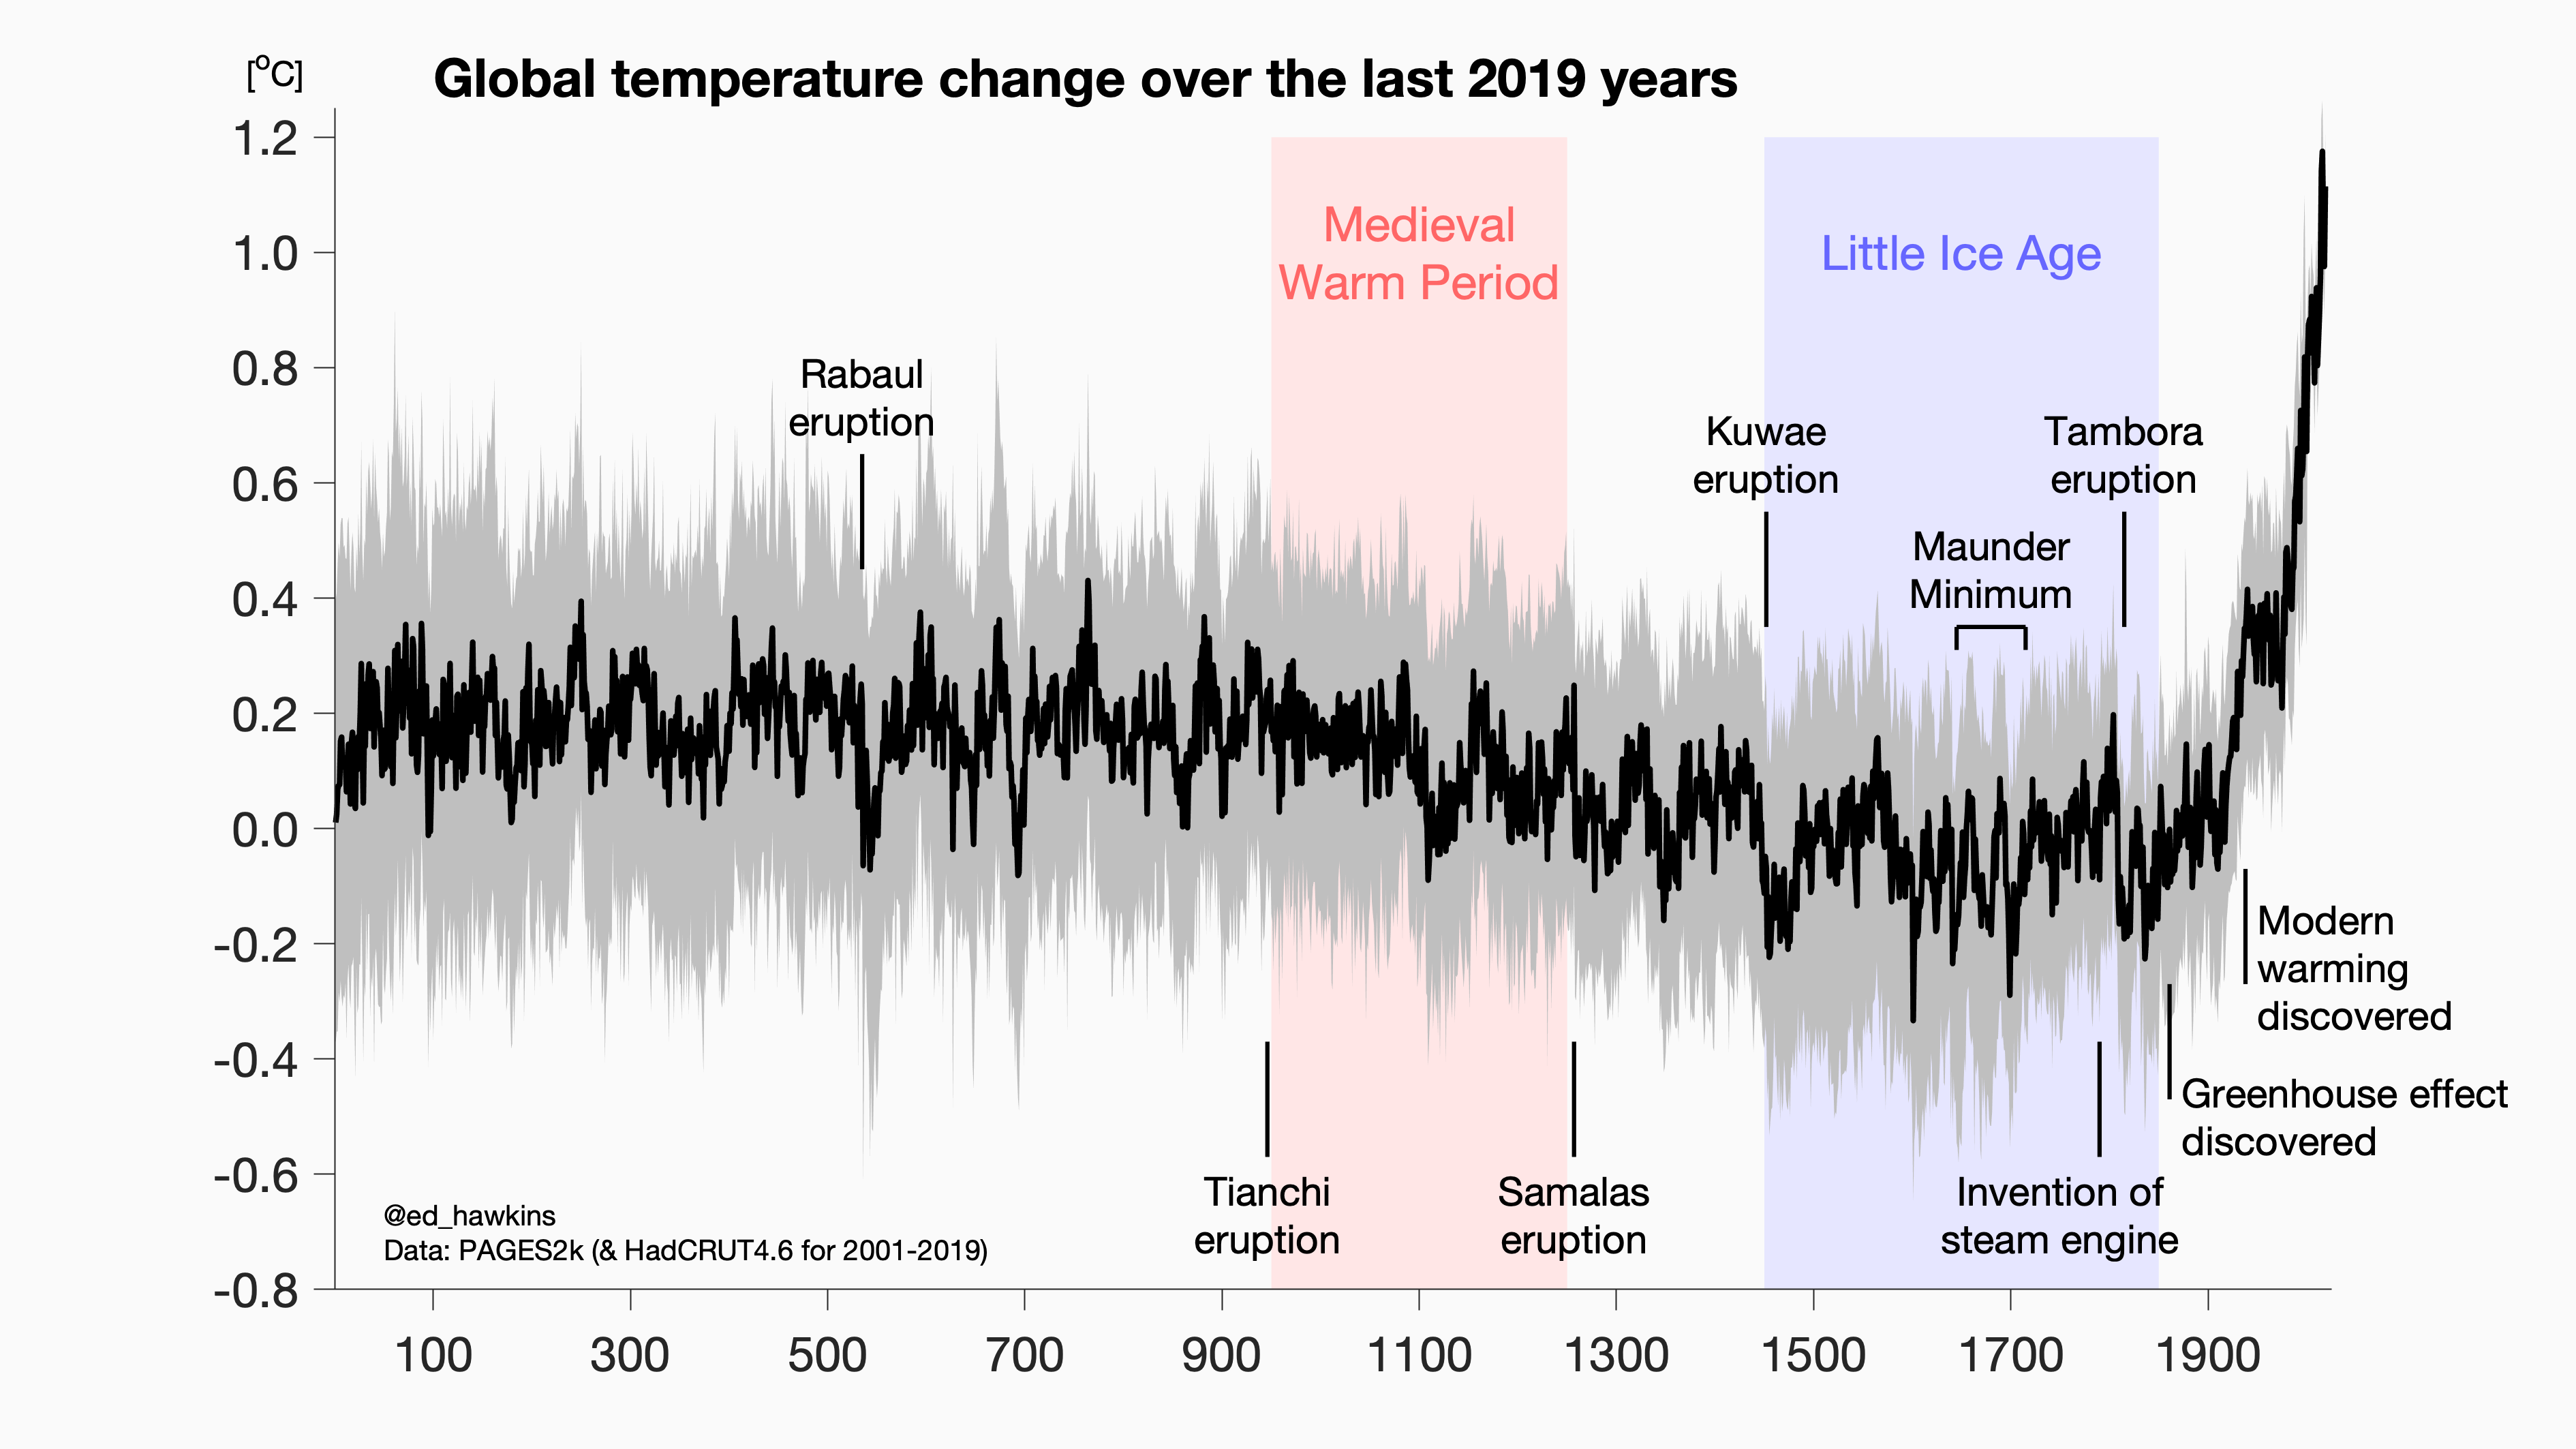
Credit: Ed Hawkins
8 billion on Nov 15, 2022
9 billion people by 2040
10 billion people by 2055
Source: United Nations Population Fund
More People = More Demand for Oil, Gas, Coal and Other Sources of Energy
------------------------------------------------------------
< Impact of Sea Level Rise >
Severe Coastal Flooding Affecting Drinking Water & Farming
Submerged Coastal Cities
Contamination of Aquifers
Mass Migration of People
Social Instability & Conflicts.
< Impact of Ocean Warming & Acidification >
More Powerful Storms and Hurricanes
Massive Rainfall, i.e. Hurricanes Harvey & Irma
Death of Coral Around the World (Mass Die-Off, 90% by 2100)
Dissolving Shells in Shell-Forming Species
Tissue Damage & Necrosis in Fish Larvae & Damage to Internal Organs
The Decline of Fish Stocks Affecting a $100 Billion Annual Fishing Industry
< Other Potentially Disastrous Consequences >
Mega-Droughts lasting 20, 30, even 40 years
The loss of 50% of All Species as we enter the Sixth Mass Extinction.
Decreasing Surface Water Supply
Global Food Shortages, Then Famine
The release of CO2 & Methane from Permafrost Melting.
The Eventual Collapse of West & East Antarctica Ice Sheets, Increasing Sea Levels Beyond Current Estimates.
Greenland's Melting reaching a tipping point potentially Adding 7 meters to Sea Level Rise.
Irreversible Climate Changes Beyond Our Control
The Air You Breathe
The Water You Drink
The Food You Eat
Your Children
Your Family
Your Community
The Elderly
In Support of a Carbon Fee and Dividend
• A Carbon Fee and Dividend
• Establishing Government Regulations on Greenhouse Gas Pollution
• Spending Public Money on Clean-Energy Research
Credit: Seth Wynes/Kimberly Nicholas, Environmental Research Letters, 2017
• National Institutes of Health: A Physician's Guide
• Mayo Clinic
• Harvard Medical School
• Good Food Institute
• Forks Over Knives
• Healthline
• Impossible Foods
• Clean Meat
• Aleph Farms
• Mission Barns
• Just
• SuperMeat
• Wild Type
• Paul Shapiro's book Clean Meat
• Kosher Bacon
-----------------------------
-----------------------------
National Academies of Sciences
The Intergovernmental Panel on Climate Change (IPCC)
World Health Organization (WHO)
The Union of Concerned Scientists
The League of Conservation Voters (LCV)
Before the Flood - Take Action
The EPA Website is Back!
EPA Relaunches Climate Change Website!
EPA Climate Change - Click Here!
Top 10 Climate Deniers - Click Here
Your Favorite Congressman - Click Here
Climate Change Deniers By State - Click Here
Best in Show - Click Here

350 New Mexico
Upcoming Events →
Click Here!
Rio Grande Sierra Club
Politics →
Click Here!
Climate Change →
Click Here!
New Mexico Climate Action
See How You Can Get Involved →
Click Here!
New Mexico Political Report
News and Brews →
Click Here!
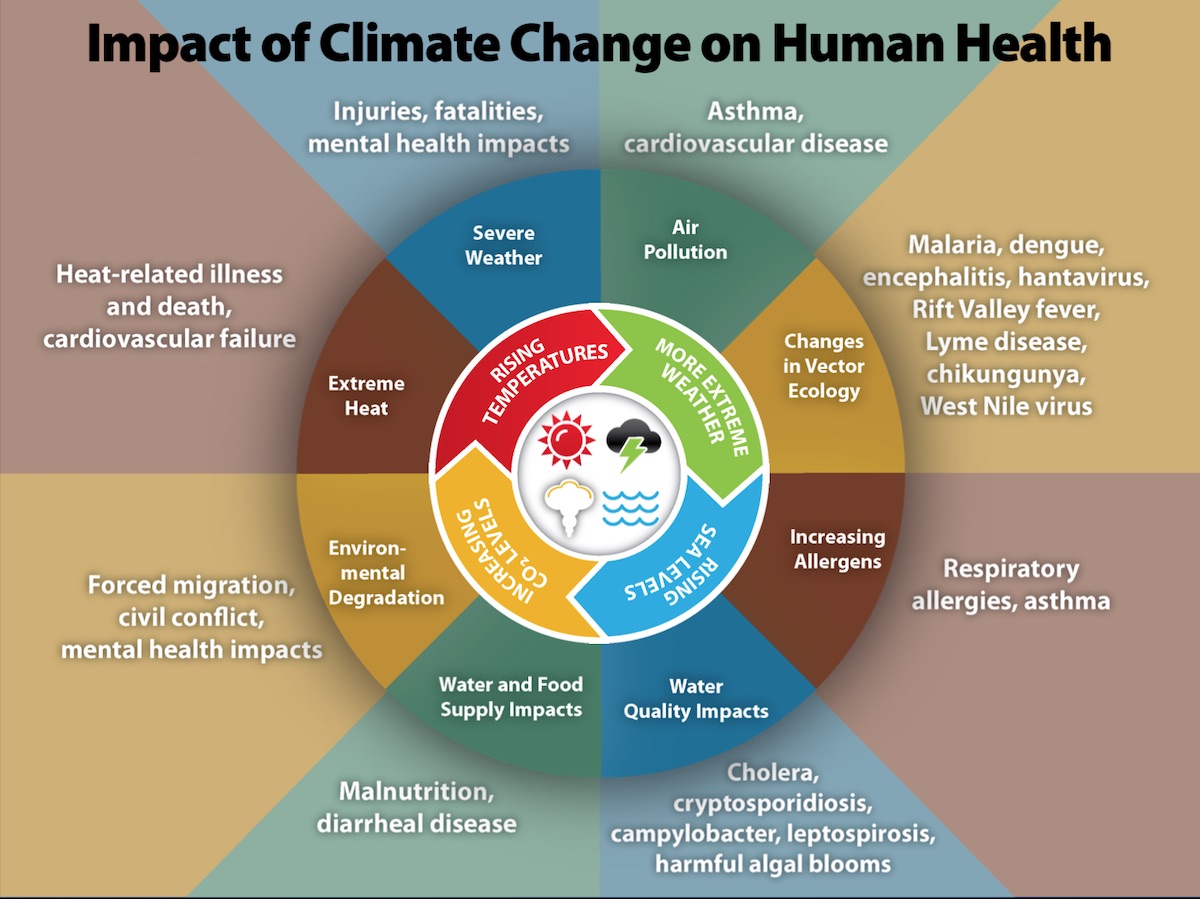
Source: CDC
------------------------------------------------------------
National Institute of Environmental Health Sciences - USA.gov
CDC - Centers for Disease Control and Prevention - USA.gov
The EPA Website is No Longer Useful! Climate Change Information has been Removed
Archived EPA page Restored by the City of Chicago - Click Here!
Count Down to 2°C

The End is Nigh
STAY ENGAGED.
Facts: Follow the Science